RE Course - 4.2 - Debugging Crash Course
4.2 Debugging Crash Course
If you’ve never used a debugger before you should go try it out. It’s important that you know how to use them. Here is a crash course in debugging.
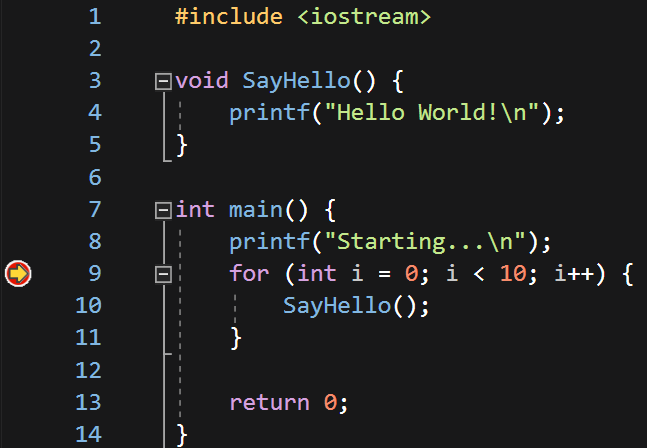
- Breakpoint - Pauses execution at the line of code the breakpoint is set on. When execution reaches a breakpoint that is known as “hitting a breakpoint”. When a breakpoint is hit execution stops before the line of code the breakpoint is on is executed. In the following example, line 9 is not executed when the breakpoint is hit. Line 9 is executed when execution continues past the breakpoint.
- Stepping - Stepping is the act of running the line of code you are currently on. This allows you to slowly execute the program line-by-line and examine everything that the program is doing.
- Step Into or Over - When stepping you can choose whether to step into or over a function call. If you step into a function call you will follow the call and you can then step through that function. If you step over a function call you will not go into that function. In the code example above if I were to step into the function call on line 10 I would be able to debug and step through
SayHello. If I step over the function call on line 10 I will not be brought into theSayHellofunction and I will instead step directly to line 11. - Step Out - If you are in the middle of a function and you want to get out of it, you can step out. This will execute the rest of the function and return to where it was called.
Those are the basics of debugging. It’s quite a simple process but it’s extremely important and helpful to developers and us reverse engineers.
This post is licensed under
CC BY 4.0
by the author.